What it is
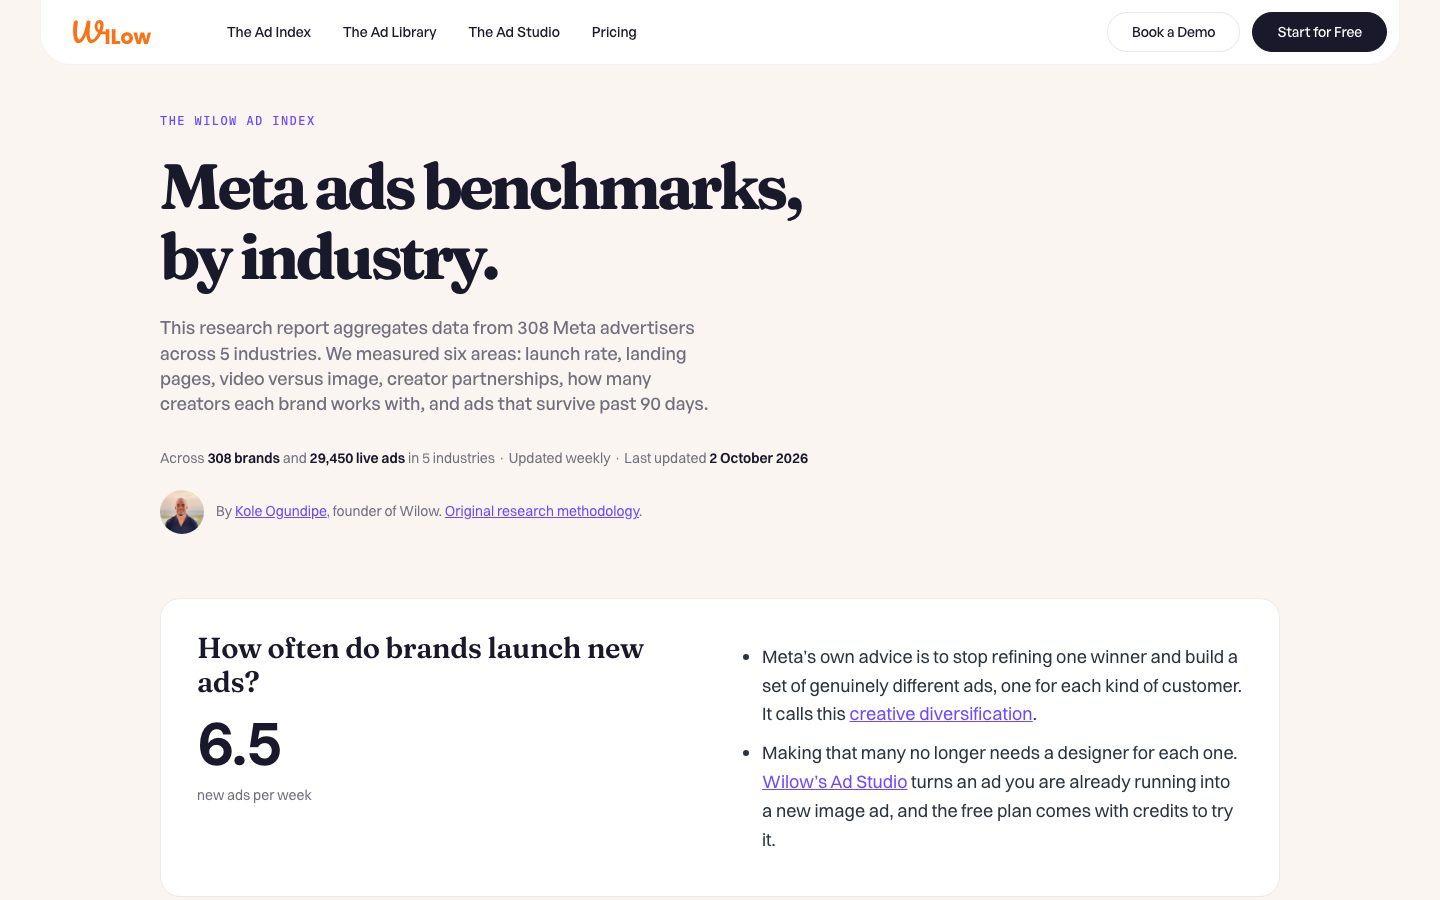
The Wilow Ad Index is a free research report of Meta ads benchmarks by industry, updated weekly.
It measures six things: launch rate, landing pages, video versus image, creator partnerships, creators per brand, and ads that survive past 90 days.
It is a hub with one benchmark page per industry and a methodology page that explains how the numbers are made.
What I did
The Ad Index is part of Wilow's marketing, which is my side of the business. It turns the data behind the free Ad Library into research other people can cite.
I replaced its first edition with this live hub on 2026-08-26. The hub rebuilds itself each week instead of standing still as a single report.
How it works
A brand joins the panel when someone looks it up in the tool, so the panel is real advertisers, not a hand-picked list.
The figures are read from live Meta ads through the free Wilow Ad Library.
A scheduled job on Vercel runs on Fridays at 20:30 UTC. It recomputes the Index from cached data and writes a fresh feed.
The pages are native Webflow pages whose numbers are filled in from that feed, so a number change never needs a republish. The same loader updates each page's structured data, and industry pages carry Dataset markup so machines can read the numbers too.
A weekly summary in Slack flags industries that have just reached the threshold for a page.
Decisions that shaped it
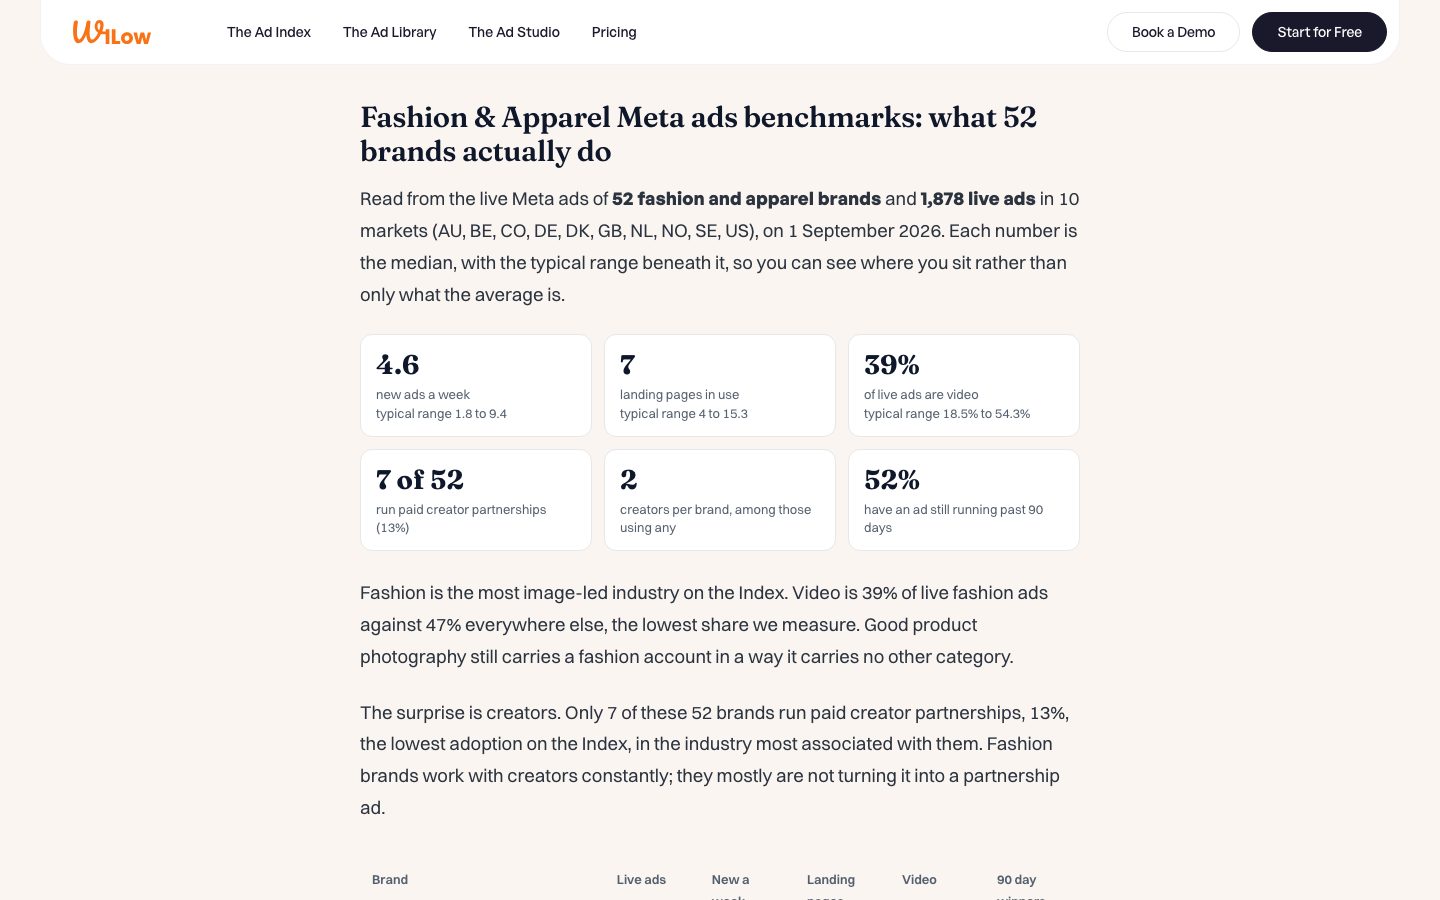
By default an industry only gets a page once 25 brands stand behind it. Below that it shows greyed out with its progress as a count out of 25, so a reader can see it coming without being shown a benchmark built on too few brands.
A check stops the release if the generated pages and their structured data disagree. A person reading the page and a machine reading its data should never see different numbers.
Each Friday build is saved to a dated file that is never overwritten, so the Index keeps its own history.
A quarter-on-quarter change counts only brands read in both periods, so a brand that has just joined the panel cannot pass for a change in the market. Below a minimum cohort the report will not call it a trend.
The page says what the data cannot show. Meta shows when an ad started, never when it stopped, and it cannot show spend, clicks or sales. The launch rate only counts ads that are still live, so it is a floor.
 Meta
 Vercel
 Webflow
 Schema.org
 Slack